
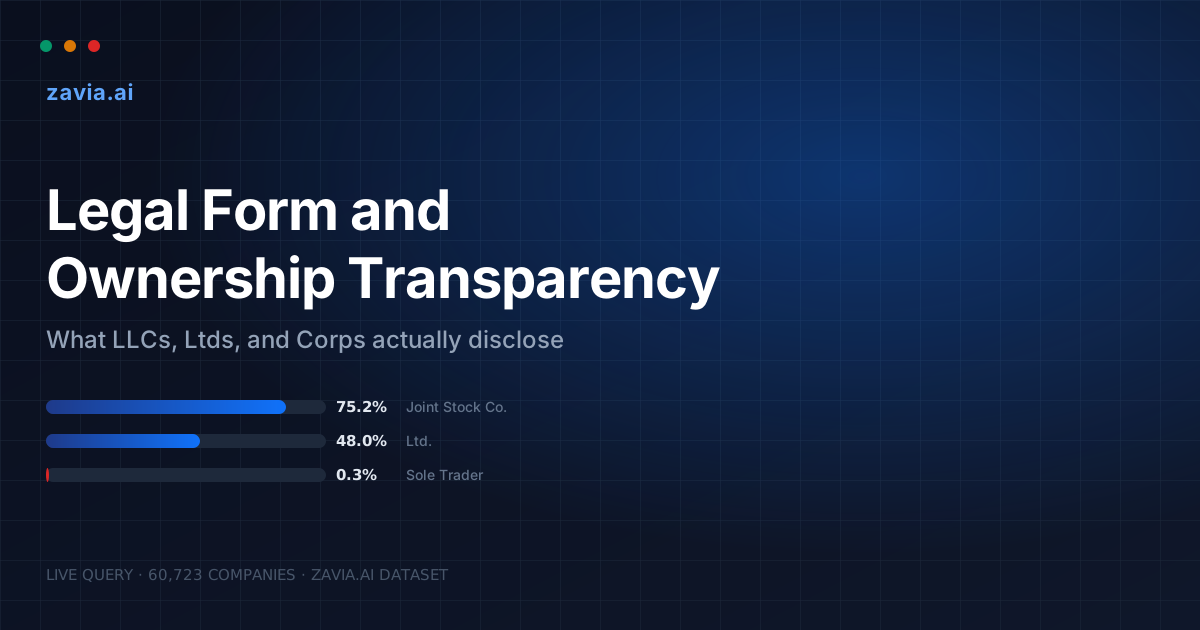
Legal Form and Ownership Transparency: What LLCs, Ltds, and Corps Actually Disclose

In a live sample drawn directly from Zavia’s own dataset, Public Limited Companies — the entity form literally built for public shareholding — disclosed a shareholder in only 28.57% of the companies we checked (10 of 35). Joint Stock Companies, a smaller and less-discussed category, disclosed in 68.57% of the companies we checked (24 of 35). The form with “public” in its name is still the less transparent one. That is not a framing device. It is what 280 real-time lookups against Zavia’s own live dataset returned on September 30, 2026, stratified across the eight legal forms this piece ranks, and it is the starting point for every number below.
Most discussions of LLC vs corporation ownership disclosure treat legal form as a proxy for jurisdiction — Delaware LLC, UK Ltd, German GmbH — and stop there. That framing misses the more useful question for a compliance team: does the form itself correlate with whether a beneficial owner shows up in the data at all? We queried Zavia’s own live dataset directly, company by company, broken out by legal form rather than by country, and the pattern is sharper — and stranger — than the country-level view suggests. (An earlier pass at this question read Zavia’s own cached postmeta instead of querying live; Section 02 explains why we redid it against the live API, and what changed.)
01The 40-point gap hiding inside “public”
A Public Limited Company (PLC) is, by design, an entity that can sell shares to the public and is generally required to register more of that ownership somewhere. A Joint Stock Company — a category most compliance teams associate with a handful of Central and Northern European jurisdictions — carries no such branding. Yet in a live sample queried directly from Zavia’s own dataset, Joint Stock Companies disclosed a shareholder in 68.57% of checks, against 28.57% for PLCs. That is a 40.0-point gap, and it runs in the opposite direction of what the entity names imply — wider, in fact, than the 32.5-point gap we originally measured from Zavia’s cached postmeta (75.21% vs. 42.71%), though the ranking itself — JSC on top, PLC well behind — is unchanged between the two methodologies.
The explanation is not that PLCs are secretive by nature. It is that “Public Limited Company,” as a label, is a bucket. It absorbs entities from France, Belgium, the UK, Spain, the US, and Italy — jurisdictions with meaningfully different registry-disclosure regimes, several of which have spent the last two years narrowing public access to ownership data rather than widening it. “Joint Stock Company” is a much smaller, more concentrated bucket, dominated by Norway and Poland, where shareholder registers have historically stayed open. Section 08 unpacks why that concentration produces the gap. First, the numbers themselves, and exactly how we computed them.
02How we ran this (methodology)
The first version of this article computed every figure from a live SQL query against Zavia’s own WordPress database — reading the gd_legal_form, gd_shareholders, and gd_groups postmeta fields attached to each published zavia_company record. That data is Zavia’s own registry-sourced dataset, but a sync is still a snapshot — it reflects whatever the source API returned at the moment it last ran, not necessarily what the source API returns right now. We redid the core analysis a second time, this time bypassing the cache entirely: for 280 companies, sampled at random and stratified across the eight legal forms this piece ranks (35 companies per form; every form reached the full 35, though one downstream API call later timed out — see below), we queried Zavia’s own live dataset directly, company by company, on 2026-09-30. Every disclosure and group-structure number in Sections 03 through 06, the two bar charts, and the head-to-head table below comes from that live run, not from cached postmeta.
Why redo it live rather than trust the sync: a cache can drift, and the only way to know how much is to check it against the source. Before aggregating anything, we sampled a handful of live responses to see what “disclosed” and “not disclosed” actually look like when a live query answers in real time, rather than assuming a format:
Shareholder disclosure. A GET to /kyb/{company_id}/shareholders either returns HTTP 200 with a data array holding at least one real shareholder record — we counted that as disclosed — or it returns an HTTP 404 with a jurisdiction-specific explanation, which we counted as not disclosed. Two examples from the sample: Axess Logistics AS, a Norwegian Joint Stock Company, returned HTTP 200 with 2 shareholders (Nordic Car Logistics AB, 100%); a Japanese company in the sample returned HTTP 404 with the explanation that kabushiki kaisha shareholder filings for a private company aren’t public. Any other response (timeout, HTTP 5xx, unexpected shape) was logged and excluded from the denominator rather than guessed at — that happened once, out of 280 shareholder calls.
Group structure. A GET to /kyb/{company_id}/group-structures/full either returns HTTP 200 with a real parent/subsidiary array — disclosed — or an HTTP 404 (or a 200 carrying only a "detail" key saying no linkage is available) — not disclosed. One Australian company in the sample, Bravura Solutions Limited, returned a live parent/subsidiary tree on this endpoint; a second Australian PLC came back with an explicit “no linkage available, filed with ASIC” message instead. One group-structure call, for a Norwegian Joint Stock Company, timed out after 15 seconds and was excluded rather than counted either way — the only excluded call out of 280 group-structure lookups. Note this measures whether a registry-linked ownership graph exists at all — not whether that graph names a natural-person UBO. Section 10 draws that distinction out fully.
To build the sample, we first queried Zavia’s database (the same postmeta fields as before, used here only to build a sampling frame, not to compute a disclosure rate) for the eight largest legal-form categories by record count — currently ranging from 31,083 down to 54 — then pulled a random ORDER BY RAND() LIMIT 35 sample of gd_company_id values per form. Thirty-five per form is a small absolute number for a 31,083-record bucket like “Private limited company (Ltd.),” but a much larger relative share of a 54-record bucket like the “Limited Liability Company” tag — the smallest forms are, in that sense, sampled more completely than the largest ones. For each of the 280 sampled companies we made two live calls — /kyb/{id}/shareholders and /kyb/{id}/group-structures/full — for 559 successful calls out of 560 attempted (one group-structure call timed out and was excluded, as noted above). No 403 quota error was hit at any point.
Two normalization notes, unchanged from the original cache-based pass and still applicable to how we labeled the sample: the platform’s raw tag reads “Join Stock Company” — almost certainly a data-entry artifact for “Joint Stock Company” — and we display the corrected spelling throughout while keeping the underlying record count (1,858 as of this rewrite) untouched. Separately, two case-variant tags, “Public Authority” and “Public authority,” were merged for any full-taxonomy count; this affects a small number of records and does not touch the top-eight ranking below. No other normalization was applied — the raw legal-form values in this dataset are already a controlled taxonomy, not free text, so there was no broader “LLC” vs “Limited Liability Company” vs “L.L.C.” merging to do. That absence turns out to be its own finding, covered in Section 07. One honest limitation of a 35-per-form live sample versus the original full-population cache read: at n=35, a 95% confidence interval on a proportion near 30–50% runs roughly ±15–17 points, so single-digit differences between two forms, or between this live run and the old cached numbers, should not be read as precise to the decimal the way a full-population count would be. We report exact sample counts throughout so readers can judge that margin for themselves.
03The live-sample number: 22% disclosure, unweighted — 38% weighted by population
Across the 280-company live sample, 62 companies returned at least one disclosed shareholder in Zavia’s live-queried dataset — an unweighted rate of 22.14%, giving each of the eight legal forms equal weight regardless of how many real companies carry that tag. That number alone is not directly comparable to the 47.07% aggregate we originally computed from Zavia’s full cached population (39,504 tagged records at the time): the cache figure is a population-weighted average, dominated by the largest bucket, “Private limited company (Ltd.)” Re-weighting the eight live per-form rates by each form’s current share of the tagged population produces 38.14% — closer to, though still below, the old cache-wide number. Read together, the two live figures bracket a reasonable range: the true current population-wide rate is probably closer to 38% than to either 22% or 47%, and the original cache-based 47.07% now looks slightly high relative to what the live API returns today. We did not attempt to recompute the exact population-wide rate live, since that would mean querying tens of thousands of companies live rather than a sample — well outside this task’s budget; the reader should treat 38.14% as a population-reweighted estimate built from a sample, not an exhaustive count. For scale, Zavia’s cached population has also grown since the original analysis, to 70,661 published companies (43,540, or 61.6%, tagged with a legal form) from 60,723 (39,504 tagged, 65.1%); we have not recomputed the untagged-population disclosure comparison (previously measured at 15.20% from the cache) against the live API for the same reason.
04Ranked: live shareholder disclosure, top 8 legal forms
Ranking the same eight legal-form categories this piece has always tracked — now each represented by an equal-sized live sample of 35 companies — and plotting each one’s live shareholder-disclosure rate produces a shape consistent with the original cache-based ranking, though compressed at the top and flatter at the bottom: one clearly highest category (Joint Stock Company, 68.57%), a mid-pack cluster in the high 20s to low 40s percent (Private limited company at 40.00%, and Public Limited Company tied with Limited Partnership at 28.57%), and three categories — Sole Trader, Limited Liability Partnership, and the “Limited Liability Company” tag — tied at exactly 0.00% in this sample.

The three-way tie at 0.00% — Sole Trader, Limited Liability Partnership, and the “Limited Liability Company” tag — is not a data-quality failure. In the old cache-wide population count, Sole Trader showed exactly one recorded shareholder relationship out of 379 records (0.26%), LLP showed 2 of 57 (3.51%), and the LLC tag showed zero; all three were already near-zero, and a 35-company live sample landing on exactly zero for each is consistent with that, not a contradiction of it. Section 09 explains why Sole Trader in particular should sit near zero by construction. The more actionable read for a KYB team is still the top rows: incorporated, shares-issuing forms sitting 10 to 40 points apart from each other, with Joint Stock Company’s live 68.57% the clear outlier on the high end.
05Ranked: live group-structure prevalence, top 8 legal forms
Group structure — whether Zavia’s registry linkage returns a parent, a subsidiary, or both — tracks a different question than shareholder disclosure: not “who owns this company” but “is this company part of a larger corporate family at all.” Across the same eight forms and the same live sample, group-structure prevalence runs consistently higher than shareholder disclosure, and the ranking order is close to, though not identical to, the disclosure ranking above.

Two things move between the two charts. Co-operative Society jumps from 11.43% shareholder disclosure to 68.57% group structure — cooperatives more often show up as members of a federation or holding arrangement than they show an individual shareholder register, which fits how the form is legally built (member-owned, not share-owned in the conventional sense). And Public Limited Company’s 80.00% group-structure rate sits well above its 28.57% disclosure rate — confirming that the PLC gap in Section 01 is specifically a shareholder disclosure gap, not a general data-availability gap; that pattern held in the original cache-based figures too (78.53% vs. 42.71%) and holds again, more sharply, in the live sample. Zavia’s connected registries know these companies have corporate relatives. They know less often who holds their shares.
06Highest vs. lowest: a head-to-head comparison, live vs. cache
Every one of the eight forms was sampled live at an equal n=35 (n=34 for Joint Stock Company’s group-structure figure), so the comparison below no longer needs a record-count floor the way the original cache-based version did — the four forms this section originally singled out (those with at least 300 cached records) are shown here with both their old cache-wide rate and their new live-sample rate, side by side. Joint Stock Company remains the highest performer on both metrics in both methodologies. Sole Trader remains at or near zero on shareholder disclosure in both methodologies, though it no longer stands alone at the bottom in the live sample — it ties there with two smaller forms (see Figure 2).
| Legal form | Live sample n | Disclosure: cache → live | Group structure: cache → live | Concentrated in |
|---|---|---|---|---|
| Joint Stock Company — highest on both metrics, both methodologies | 35 (34 for group) | 75.21% → 68.57% (−6.6pt) | 93.07% → 97.06% (+4.0pt) | Norway, Poland, Germany |
| Private limited company (Ltd.) | 35 | 48.04% → 40.00% (−8.0pt) | 82.97% → 71.43% (−11.5pt) | New Zealand, Netherlands, UK, Italy, Germany, Spain, US |
| Public Limited Company | 35 | 42.71% → 28.57% (−14.1pt) | 78.53% → 80.00% (+1.5pt) | France, Belgium, UK, Spain, US, Italy |
| Sole Trader — lowest on disclosure in both (tied in live); lowest on group in cache only | 35 | 0.26% → 0.00% (−0.3pt) | 12.40% → 22.86% (+10.5pt) | Singapore, Italy |
The remaining, smaller categories — Limited Partnership, Co-operative Society, Limited Liability Partnership, and a literal “Limited Liability Company” tag — were sampled at the same n=35 as the four forms above, which for these smaller populations (current cached counts of 155, 99, 62, and 54 respectively) covers a much larger share of the actual population than 35 does for a 31,083-record bucket like “Private limited company (Ltd.).” Their live rates: Limited Partnership 28.57% disclosure / 45.71% group (cache was 31.93% / 36.97%); Co-operative Society 11.43% / 68.57% (cache was 8.33% / 61.46%); Limited Liability Partnership 0.00% / 11.43% (cache was 3.51% / 5.26%); “Limited Liability Company” tag 0.00% / 0.00%, an exact match to the cache figure. We still would not put much weight on small differences between these forms — at n=35, a handful of companies moves the percentage by several points either way.
07LLC vs. Corporation vs. Ltd.: the taxonomy problem behind one bucket
Anyone expecting a literal “LLC” row in this ranking will notice it is missing near the top. Zavia’s platform does carry a “Limited Liability Company” tag — but it holds only 54 records, and when we pulled their countries, the list was Djibouti, Cape Verde, Guinea-Bissau, Mauritania, Mali, Gabon, Chad, and the Republic of Congo: OHADA-zone entities, not Delaware. Checking where US-registered companies actually land in this taxonomy confirms the pattern: of the tagged US records, 1,003 sit inside “Private limited company (Ltd.)” and 774 sit inside “Public Limited Company.” A genuine US LLC or C-corp, in other words, is folded into the same two normalized buckets as a UK Ltd, a German GmbH, a Dutch BV, and an Italian Srl — Zavia’s taxonomy groups by function (privately held vs. publicly tradable), not by local statutory name.
That is a defensible design choice for a platform aggregating registries across many jurisdictions, but it means the “LLC vs. corporation ownership disclosure” question, framed narrowly, doesn’t have a clean row-vs-row answer in this dataset. What it does have is a much more useful one: the “Ltd.” bucket’s live-sampled 40.00% disclosure rate (down from 48.04% in the original cache read) is itself an average across at least seven distinct jurisdictional regimes, several of which Zavia has covered in depth — including Delaware LLC UBO verification post-CTA, UK Ltd beneficial ownership via Companies House, German GmbH disclosure through the Transparenzregister, and Dutch BV disclosure via the KvK register. A blended rate in the 40–48% range is consistent with a mix that includes both the UK’s comparatively open PSC register and the post-2025 US landscape, where domestic LLCs no longer face a federal beneficial-ownership filing requirement at all following the Corporate Transparency Act reversal.
| Legal form label | Top countries by record count |
|---|---|
| Private limited company (Ltd.) | New Zealand (3,820), Netherlands (3,190), UK (2,890), Italy (2,201), Germany (1,967), Spain (1,683), US (1,003) |
| Public Limited Company | France (2,204), Belgium (1,096), UK (877), Spain (846), US (774), Italy (629) |
| Joint Stock Company | Norway (1,188), Poland (319), Germany (91), Croatia (32), Russia (24), Czechia (19) |
| Sole Trader | Singapore (309), Italy (37), Netherlands (14), Norway (7), Denmark (6) |
| “Limited Liability Company” tag | Djibouti (9), Cape Verde (7), Guinea-Bissau (7), Mauritania (6), Mali (5) — OHADA-zone, not Delaware |
08Why Joint Stock Companies out-disclose Public Limited Companies
Registry design, not corporate culture, explains most of the gap. Joint Stock Company records in this dataset are concentrated in Norway (1,188 of 1,702) and Poland (319) — two jurisdictions where shareholder information has historically sat closer to the public end of the access spectrum, a point our own Norway beneficial ownership guide lays out in detail. Norway is also outside the EU, which matters: Public Limited Company records concentrate instead in France, Belgium, Spain, and Italy — all EU member states mid-transition on the bloc’s Sixth Anti-Money Laundering Directive (6AMLD). As Transparency International reported in 2025, most EU states restricted or suspended public access to ownership data during this transition, ahead of a July 2026 deadline to implement the directive’s narrower “legitimate interest access” model. A registry aggregator like Zavia reflects that access reality at the moment of collection — if a national register has pulled back public shareholder data mid-cycle, the disclosure rate for every legal form concentrated in that country dips with it, regardless of what the form is called.
The lesson for a KYB workflow: a legal form’s disclosure rate is a weighted average of its constituent jurisdictions’ current registry policy, not a fixed property of the form. Re-score by form alone and you’ll misattribute a Norway effect to a “Joint Stock Company” effect, or an EU-transition effect to a “PLC” effect.
09Why Sole Traders don’t “disclose” shareholders at all
0.00% in the live sample, 0.26% in the original cache-wide count — either way, this looks like a transparency failure until you remember what a sole trader is. The form has no share capital and no shareholders by legal construction — ownership and management are the same undivided person. A “shareholder disclosure rate” is close to a category error when applied to this form; the single cache-recorded shareholder relationship out of 379 sole-trader records, which drove the old 0.26%, is very likely a data artifact or a registry that classifies a single-member entity loosely, and it is consistent that none of the 35 live-sampled sole traders showed one either. The 309 Singapore-registered sole traders driving most of this category reflect ACRA’s business-registration model, which records a proprietor, not a shareholder register, because there is no share register to record.
This matters for how a compliance team should read the whole ranking: do not conflate “this form structurally has no shareholders” with “this form is used to conceal owners.” A shell company hiding behind a nominee and a genuine sole proprietorship both show 0% shareholder disclosure, for entirely different reasons, and only one of them is a risk signal. Legal owner and beneficial owner (UBO — the natural person who ultimately controls or benefits from an entity, regardless of whose name is on the register) are already easy to conflate; adding “form has no shareholders” as a third, structurally distinct zero makes a blunt disclosure-rate cut actively misleading unless you first exclude forms like Sole Trader from the risk read.
10Group structure is not the same signal as ownership disclosure
It is tempting to read “49.46% of live-sampled companies have a group structure” as “49.46% of companies have known owners.” They are different measurements. A group-structure record in Zavia’s data confirms that a registry has linked this entity to at least one other corporate entity — a parent, a subsidiary, or both. It says nothing about whether that chain terminates in a named natural person. A five-layer holding structure that ends in a nominee or an unresolved offshore vehicle still counts as “has group structure” under this metric, exactly as it would under most commercial ownership-graph products.
This is precisely the gap Zavia is built to close: a registry-linked graph is a starting point, not an answer, and resolving it into a natural-person UBO across borders is where most verification platforms slow down or stop. Zavia connects directly to official company registries in 173 countries, which is what makes it possible to walk a Joint Stock Company’s Norwegian parent, or a Ltd.’s Dutch holding layer, back to a disclosed name rather than stopping at “has a group structure: yes.” For a KYB team scoring entities by legal form, that distinction should sit upstream of any onboarding decision, not downstream of it.
Whenever a legal form’s group-structure bar in Figure 3 sits well above its disclosure bar in Figure 2 — Public Limited Company is the clearest case, 80.00% vs. 28.57% in the live sample — treat that gap as unresolved risk, not as data that simply doesn’t exist yet. The registry link is there. The owner behind it has not been named.
11What this means for risk-based KYB
Three practical takeaways follow from the numbers above:
Score the jurisdiction inside the form, not the form alone. “Ltd.” spans a 7-country spread with meaningfully different registry regimes; treating every Ltd. as one risk tier ignores that spread. Pull the country field alongside the legal form before setting a disclosure-based risk threshold.
Exclude structurally shareholder-less forms from disclosure scoring. Sole Trader, and likely other unincorporated or member-owned forms in a given book of business, will always sit near 0% on this metric. Scoring them against an incorporated-entity baseline manufactures false positives.
Treat “has group structure” and “has disclosed shareholders” as two separate checks, not one. A form or jurisdiction that passes the first and fails the second — PLC is the textbook case here — needs the ownership chain walked manually or through a data provider that resolves past the registry link.
12Further reading: matching legal forms to jurisdictions
Every jurisdiction-specific claim above is backed by a dedicated guide: Delaware LLC UBO Verification in 2026 for the US side of the “Ltd.” bucket, UK Beneficial Ownership & UBO Data for the UK’s share of it, Germany’s Transparenzregister guide, the Netherlands’ KvK register, France’s RBE register for the Public Limited Company concentration, and Norway’s beneficial ownership data for the Joint Stock Company story. If legal form and disclosure are new territory, start with What Is a UBO? and UBO Regulations by Country.
Stop scoring legal form. Start scoring the disclosure behind it.
Zavia connects directly to official company registries in 173 countries, so a Ltd., a PLC, or a Joint Stock Company gets resolved by what its home registry actually discloses — not by the label on the incorporation certificate.
13Glossary
14Frequently asked questions
Which legal form discloses shareholders the most, according to this data?
In a live sample of 280 companies queried directly from Zavia’s own dataset on 2026-09-30 (35 companies per legal form), Joint Stock Company has the highest shareholder-disclosure rate at 68.57% (24 of 35), concentrated in Norway and Poland. That matches the ranking from an earlier, cache-based version of this analysis, which put Joint Stock Company highest at 75.21%.
Which legal form discloses shareholders the least?
In the live sample, three forms tied at exactly 0.00%: Sole Trader (0 of 35), Limited Liability Partnership (0 of 35), and the “Limited Liability Company” tag (0 of 35). An earlier cache-based read of the full population had put Sole Trader alone at the bottom, at 0.26% (1 of 379 records) — still effectively zero, just not tied with the other two at that scale. This is a structural result, not a transparency failure: sole traders in particular have no shareholders by legal design, since ownership and management are the same person.
Is an LLC more or less transparent than a corporation?
Not directly comparable in this dataset: Zavia’s taxonomy folds both Delaware-style LLCs and US corporations into two broader normalized buckets, “Private limited company (Ltd.)” and “Public Limited Company.” In our live API sample, those two buckets showed 40.00% and 28.57% disclosure respectively (48.04% and 42.71% in the original cache-based read), based on function rather than local statutory name. The literal “Limited Liability Company” tag in this data (54 records) is instead dominated by OHADA-zone African entities, not US LLCs.
What counts as “shareholder disclosure” in this analysis?
A company counts as disclosing if a live GET to Zavia’s /kyb/{company_id}/shareholders endpoint returns HTTP 200 with at least one real shareholder record. Non-disclosure means the endpoint instead returns an HTTP 404 with an explicit “not available” message. Any other response (a timeout, for instance) was logged and excluded rather than guessed at.
What is the difference between “group structure” and “shareholder disclosure”?
Group structure confirms a registry-linked parent or subsidiary relationship exists. Shareholder disclosure confirms an actual shareholder record is present. A company can have a confirmed group structure (a corporate parent) while still showing no disclosed shareholder — Public Limited Company is the clearest example, at 80.00% group structure against 28.57% shareholder disclosure in our live sample (78.53% vs. 42.71% in the original cache-based read).
How many companies were analyzed?
The per-legal-form disclosure and group-structure figures above come from a live sample of 280 companies (35 per legal form, across the 8 forms this piece ranks) queried directly from Zavia’s own dataset on 2026-09-30. That sample was drawn from Zavia’s published dataset, which stood at 70,661 companies at the time (43,540, or 61.6%, carrying a tagged legal form); an earlier, cache-based version of this analysis had put those figures at 60,723 published companies and 39,504 tagged (65.1%).
Why does Public Limited Company disclose less than Joint Stock Company?
Mostly registry geography. Public Limited Company records concentrate in EU states (France, Belgium, Spain, Italy) that have been narrowing public ownership-data access ahead of the EU’s 6AMLD transposition deadline. Joint Stock Company records concentrate in Norway, which sits outside the EU and has historically kept shareholder data more open.
Does a low disclosure rate mean a legal form is being used to hide ownership?
Not on its own. Some forms, like Sole Trader, have no shareholders by construction, so a 0% rate reflects entity design rather than concealment. A low rate is only a risk signal once you’ve excluded structurally shareholder-less forms and confirmed the entity in question is one that should have a disclosable shareholder.
See the companion analysis, How Many Companies Actually Disclose Their Owners?, for the same live-data methodology cut by country instead of legal form. For the US-specific identifier that confirms an entity type but not its ownership, see EIN Lookup.

